WISEdash Key Performance Indicators
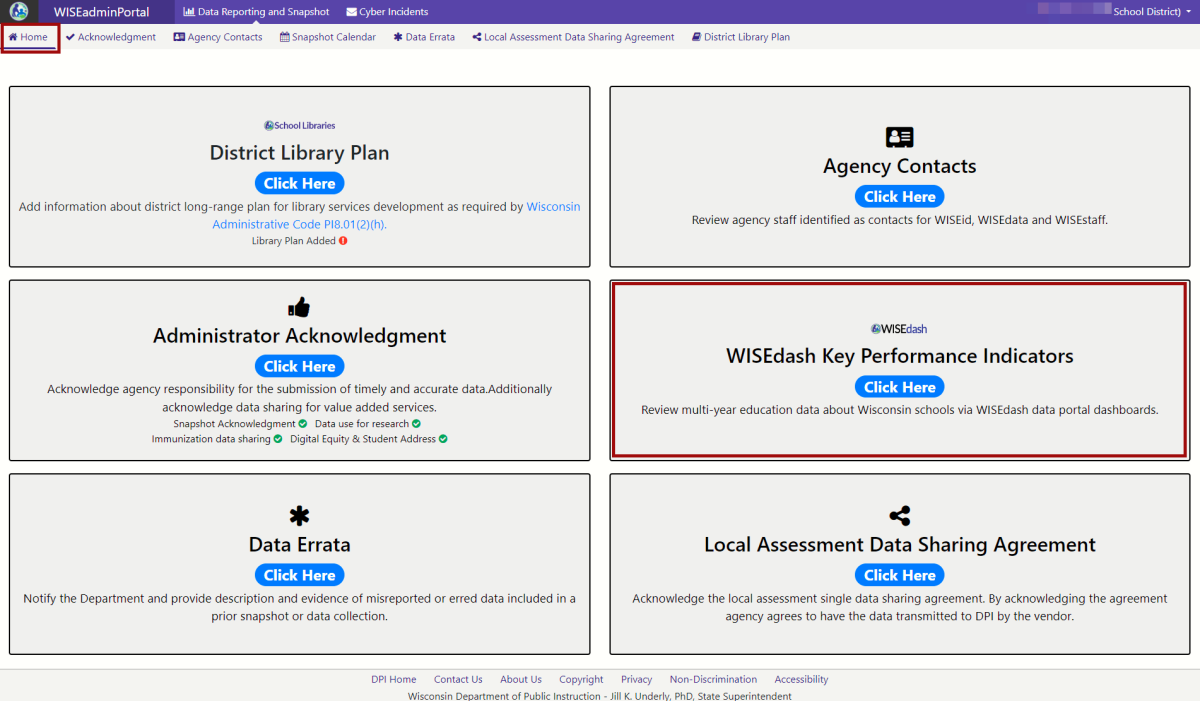
Through WISEadmin Portal, district administrators can quickly access key performance indicators (KPIs) such as enrollment data and year end data in WISEdash for Districts. The Enrollment and Year End dashboards in WISEdash for Districts is designed to let administrators view enrollment and year end data for their district at a glance and easily filter the data by school or school type.
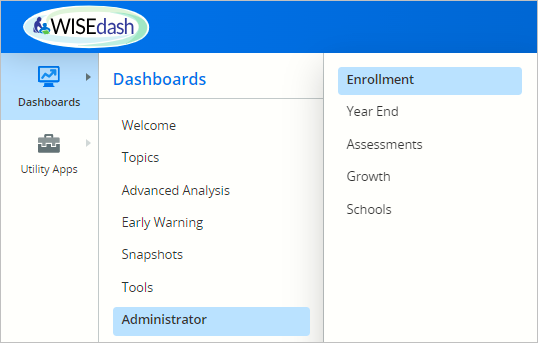
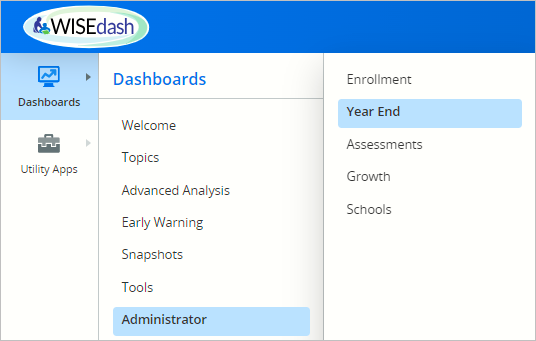
Clicking the KPI button on WISEadmin Portal opens another tab in your browser, displaying the Administrator dashboards: Enrollment, Year End, Assessment, Growth and Schools.
To learn more about each dashboard, click the accordion headers below to expand and view content:
- ENROLLMENT
-
 The Enrollment dashboard in WISEdash for Districts is designed to let administrators view enrollment (Third Friday of September) data for their schools and district at a glance and easily filter the data by school or school type.
The Enrollment dashboard in WISEdash for Districts is designed to let administrators view enrollment data for their district at a glance and easily filter the data by school or school type.
These are not interactive displays, meaning when users ‘click’ on the data displayed, nothing happens. Student profiles cannot be viewed from this data.
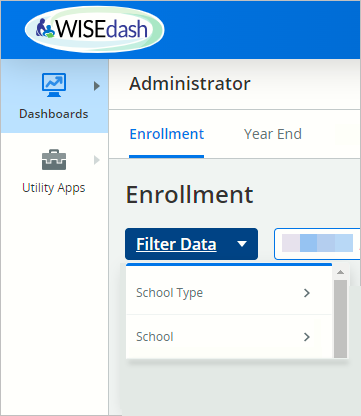 You can filter the data by clicking the Filter button and selecting either School Type or a specific School. Using these filters will let you view data for a specific group of schools in your district instead of the whole district at once.
In the Administrator Enrollment dashboard, you can view:
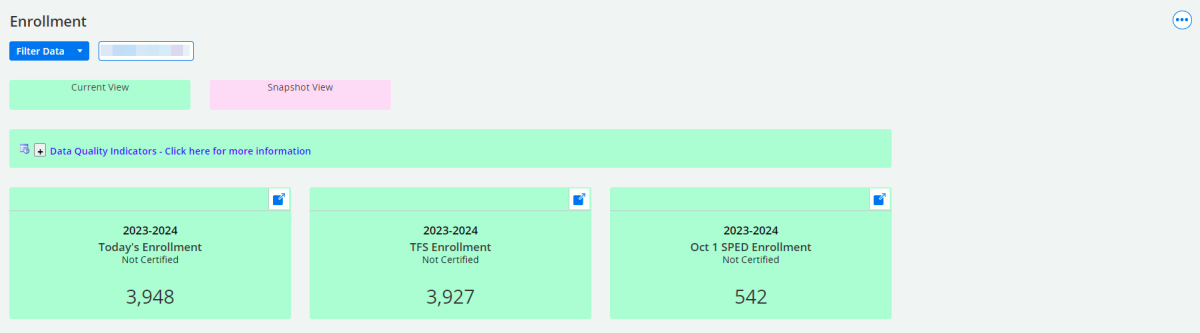
- current (not certified) data in green, displayed by school, and
- snapshot (certified) data compiled from the past three years of snapshots in purple, displayed for the district as a whole.
To learn more about the different parts of the Administrator Enrollment Dashboard, click the links below:
Current Enrollment DQIs Current Enrollment by School
Current TFS Enrollment by School Current Oct 1 CC by School
Snapshot Data - TFS Enrollment TrendsCurrent Data (green)
Current Data - Enrollment Data Quality Indicators:
Three Data Quality Indicators (DQI) for the current school year are at the top of the dashboard screen:
- Today’s enrollment
- Third Friday in September enrollment
- October 1 child count enrollment
This dashboard is different from the Topics > Main > Enrollment dashboard, and is also unique from the Snapshots > TFS Count Date and Oct 1 Child Count dynamic crosstabs.
Each DQI has a corresponding bar graph further down the screen.
Current Data - Enrollment (Overall) by School
This display answers the question, “What is the current enrollment for each of my schools?” The answer is displayed as a single vertical bar, capped with a number, labeled with the name of each school within your district.

Hovering your cursor over each bar will display a floating ‘pop-up’ that names the school, and provides the number of students enrolled in that school, based on the date displayed at the top, center of the graph.
The numbers between the overall enrollment and the TFS enrollment may differ because:
- New students enrolled after the TFS count date
- Students disenrolled sometime between their first day for this school year and the current viewing date
- Other nuanced scenarios such as: overlapping enrollments, etc.
Resources:
Current Data - TFS Enrollment by School
This display answers the question, “What is the TFS count date enrollment for each of my schools?” The answer is displayed as a single vertical bar, capped with a number, labeled with the name of each school within your district.
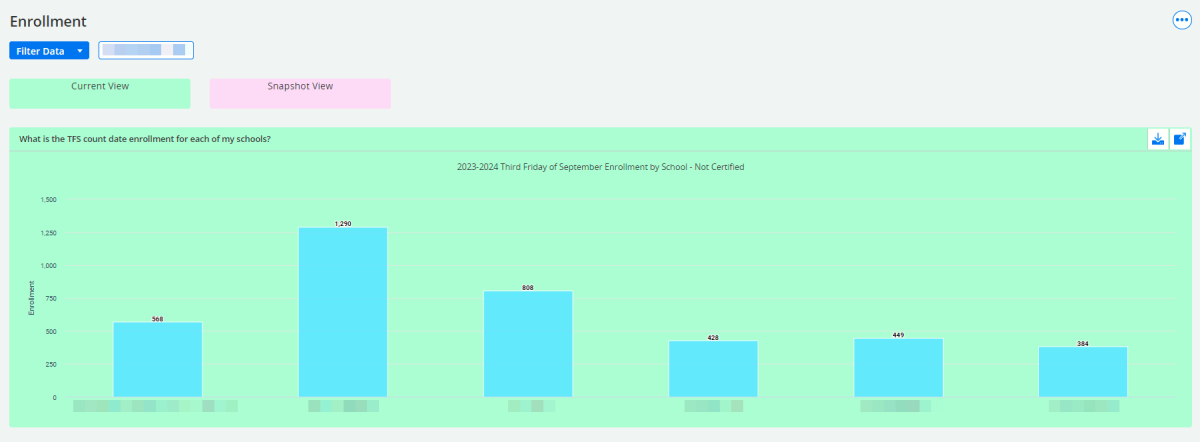
Hovering your cursor over each bar will display a floating ‘pop-up’ that names the school, and provides the number of students enrolled in that school, based on the TFS date for the current school year.
Resources:
- WISEdash for Districts, About the Data: Snapshot Dashboards - Third Friday of September webpage
- Count Inclusion, Third Friday of September data element page
Current Data - October 1 Child Count Enrollment by School
This display answers the question, “What is the October 1 child count of students with disabilities for each of my schools?” The answer is displayed as a single vertical bar, capped with a number, labeled with the name of each school within your district.
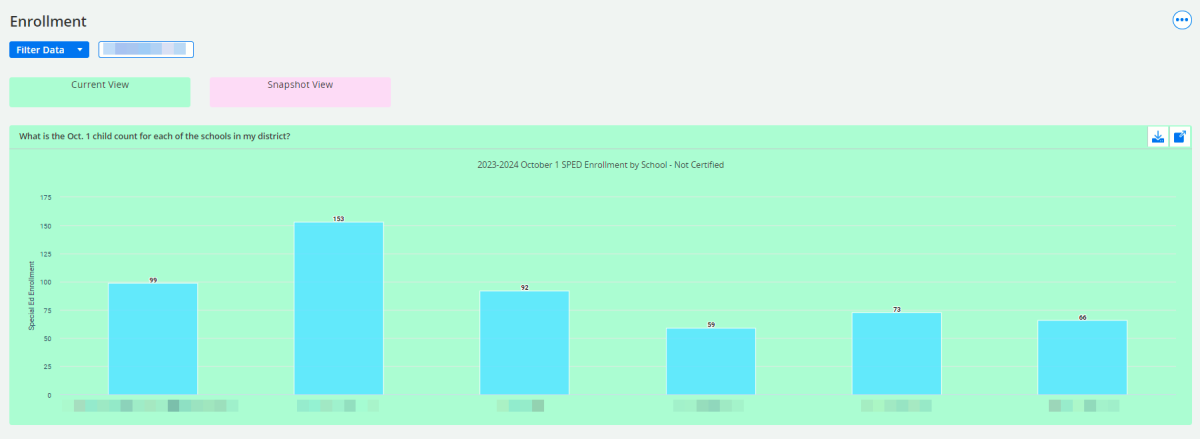
Hovering your cursor over each bar will display a floating ‘pop-up’ that names the school, and provides the number of special education students enrolled in that school, based on the October 1 child count for the current school year.
Since this number only displays enrolled students receiving special education services, this number will likely be far smaller than the numbers for the above two enrollment graphs.
Resources:
- WISEdash for Districts, About the Data: Snapshot Dashboards - October 1 Child Count webpage
- Count Inclusion, October 1 Child Count data element page
Snapshot/Certified Data (purple)
Snapshot Data - Enrollment: What is the TFS enrollment Trend?
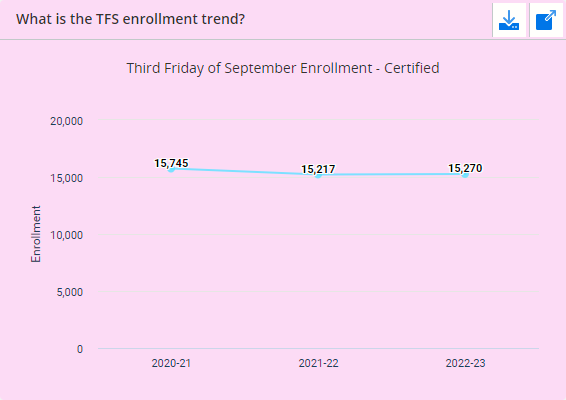 The snapshot section of this dashboard provides data for the entire district, not by individual schools. There are six small trend displays, all based on TFS data over a three-year span for the current school year and two years prior. The ‘TFS Trend’ line graph appears first. All other snapshot graphs use disaggregated data from this trend graph to display trends by a specific sub-group
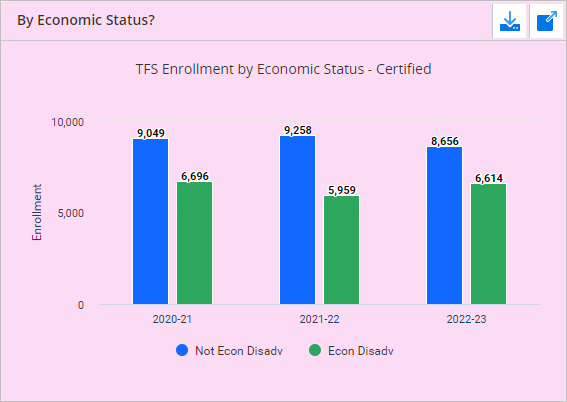 By Economic Status?
This displays the three years of TFS trend data by economic disadvantaged status and not economic disadvantaged status.
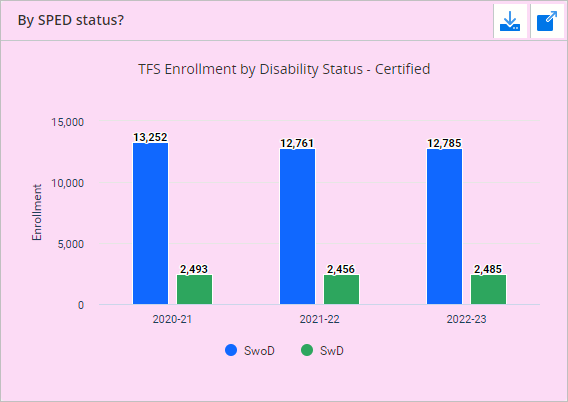 By SPED Status?
This displays the three years of TFS trend data by special education status: student with disabilities and students without disabilities.
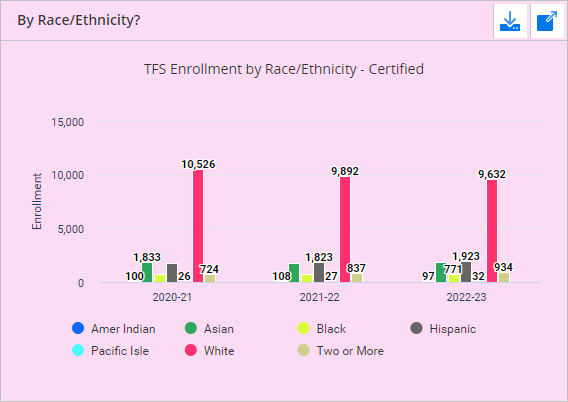 By Race/Ethnicity?
This displays the three years of TFS trend data by the following race/ethnicity categories: American Indian, Asian, Black, Hispanic, Pacific Islander, Two or More, and White.
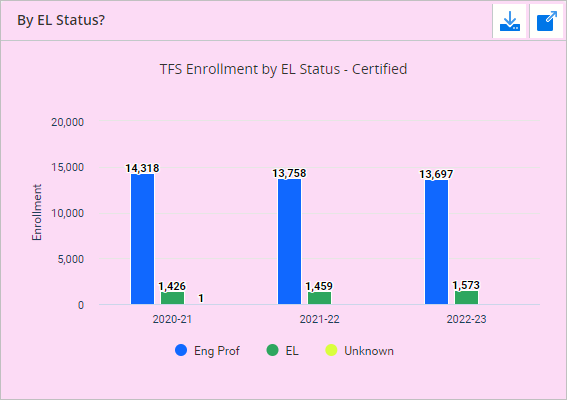
By EL Status?
This displays the three years of TFS trend data by the EL status of English Proficient, English Learner (EL), and Unknown.
- YEAR END
-
 The Year End (YE) dashboard in WISEdash for Districts is designed to let administrators view year end data (school completion rate and type, e.g., graduation and dropout rate) for their district at a glance and easily filter the data by school or school type.
These are not interactive displays, meaning when users ‘click’ on the data displayed, nothing happens. The data cannot be viewed in a table, and student profiles cannot be viewed from this data.
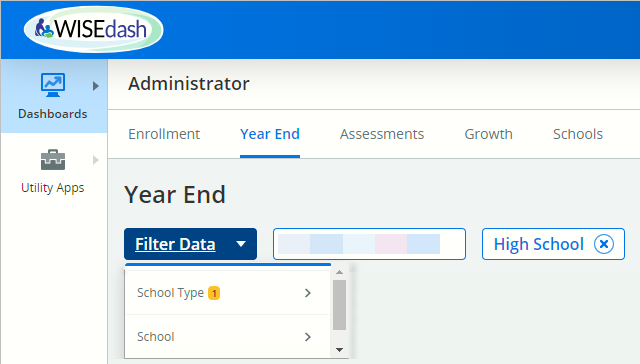 You can filter the data by clicking the Filter button and selecting either School Type or a specific School. Using these filters will let you view data for a specific group of schools in your district instead of the whole district at once.
In the Administrator Year End dashboard, you can view:
- current (not certified) data in green, displayed by school, and
- snapshot (certified) data compiled from the past three years of snapshots in purple, displayed for the district as a whole.
To learn more about the different parts of the Administrator Enrollment Dashboard, click the links below:
Current Year End DQIs Current Year End by School
Current Attendance Rate by School Current Early Warning Absenteeism by District
Snapshot Data - Year EndCurrent Data (green)
Current Data - Year End Data Quality Indicators:
Three Data Quality Indicators (DQI)for the current school year are at the top of the dashboard screen:
- 4 Year Graduation Rate
- Dropout Rate
- Chronically Absent
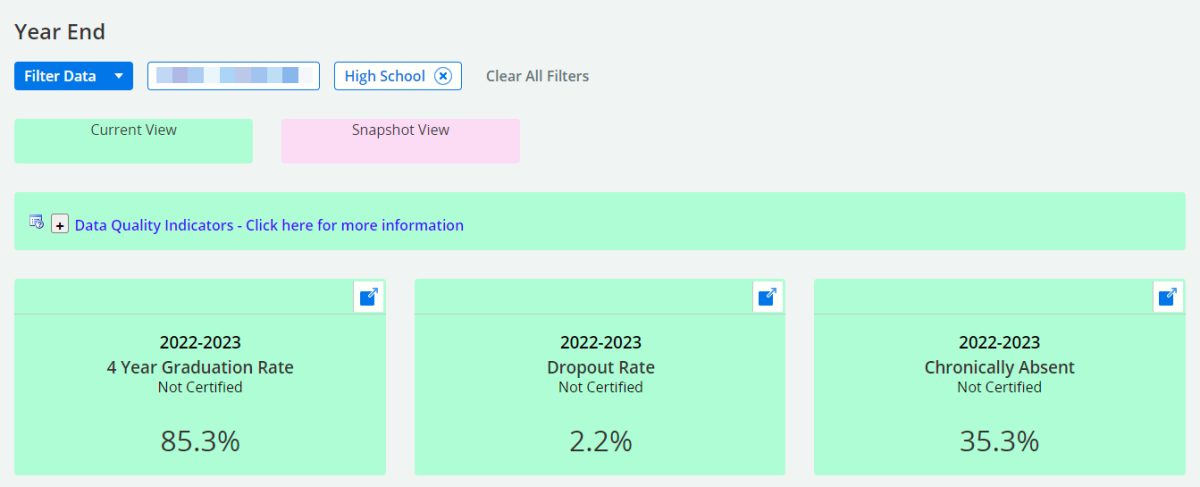
This dashboard is different from the Topics > Main > Attendance-Dropouts dashboard, and is also unique from the Snapshots > YE Completion dynamic crosstabs.
Each DQI has a corresponding bar graph further down the screen.
Current Data - Year End (Overall) by School
This display answers the question, “What are our 2022-23 high school completion outcomes?” The answer is displayed as a double, vertical bar per school, capped with a number. Each school displays the number of completers and the number of dropouts.
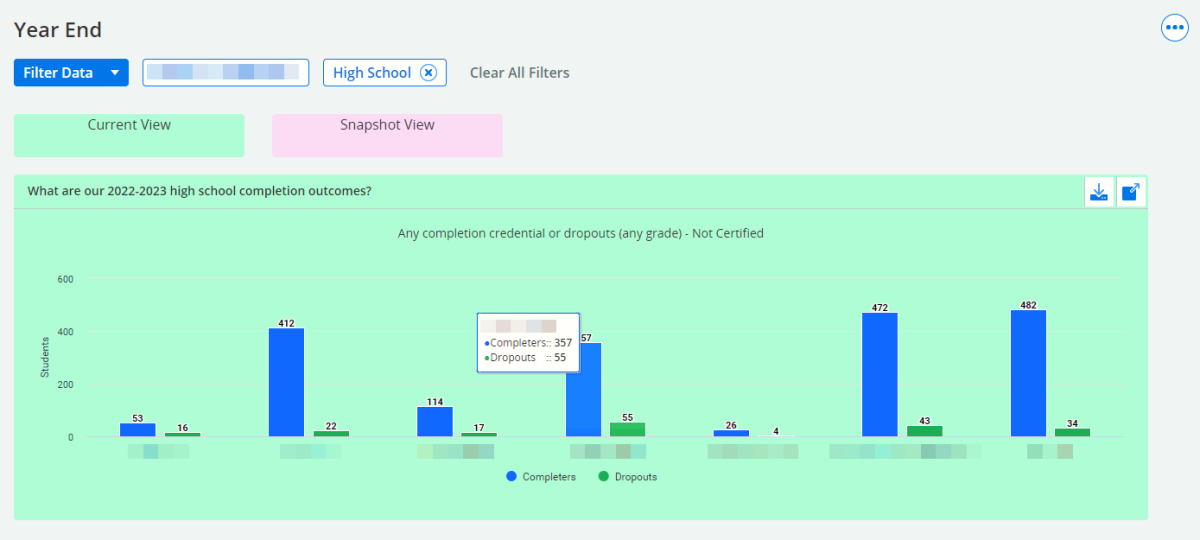
Hovering your cursor over each bar will display a floating ‘pop-up’ that names the school, and provides the number of students who completed as completers and as dropouts in that school, based on the date displayed at the top, center of the graph.
Resources:
- WISEdash for Districts, About the Data: Dropout Dashboards
- WISEdash for Districts, About the Data: High School Completion Dashboards
- Credential Type data element webpage
Current Data - Attendance Rate by School
This display answers the question, “What is our 2022-23 attendance rate at each school?” The answer is displayed as a single vertical bar, capped with a number, labeled with the name of each school within your district.
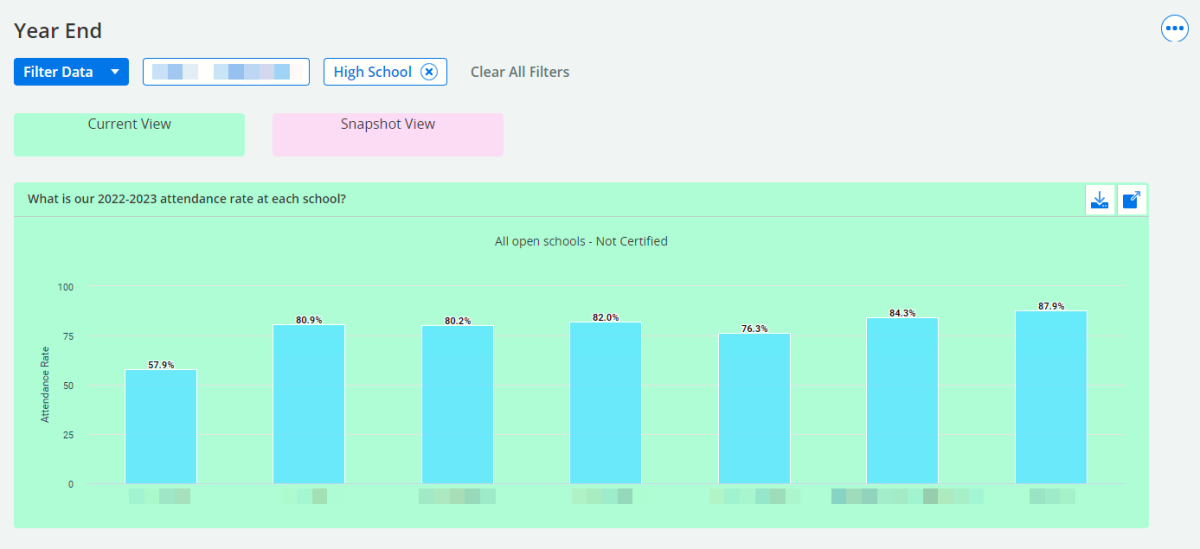
Hovering your cursor over each bar will display a floating ‘pop-up’ that names the school, and provides the number of students enrolled in that school and the attendance rate percentage, based on the TFS date for the current school year.
Resources:
- WISEdash for Districts, About the Data: Attendance Dashboards
- WISEdash for Districts, How-To: Attendance and Absenteeism User Guides**
**NOTE: Not all of these User Guides have been updated to reflect the new WISEdash for Districts layout yet. We appreciate your patience as we work to upgrade our resources.
Current Data - Early Warning Absenteeism by School
This display answers the question, “What is our current high risk early warning absenteeism?” The answer is displayed on a district level, as three vertical bars, capped with a percentage, labeled with the categories:
- Low Risk
- Moderate Risk
- High Risk
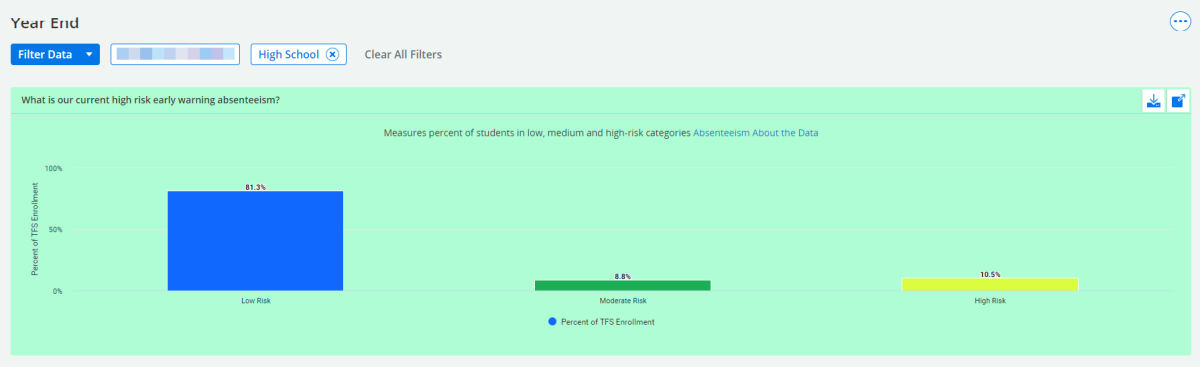
Hovering your cursor over each bar will display a floating ‘pop-up’ that names the percentage of TFS enrollment and its equivalent measure by number of students, within each risk-category.
Resources:
Snapshot/Certified Data (purple)
Snapshot Data - Year End
The snapshot section of this dashboard provides data for the entire district, represented by individual schools. There are three displays: one for four-year completion rates, one for drop-out rates and the last for chronic absenteeism.
What is our Certified 4-Year HS Completion Rate?
This displays any type of completion credential for the most recent certified year-end completion data. This data reflects the data collected from the most recently completed December snapshot.
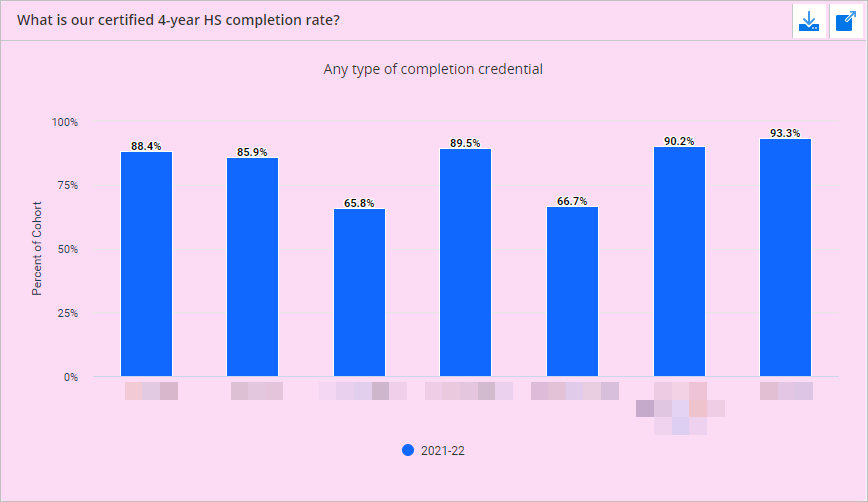
Hovering your cursor over each bar will display a floating ‘pop-up’ that names the percentage of completers and its equivalent measure by number of students, within each school.
What is our Certified Dropout Rate for Each School?
This displays the certified dropout rate for all schools in your district having grade 7 or higher. This data reflects the past three years of certified data.
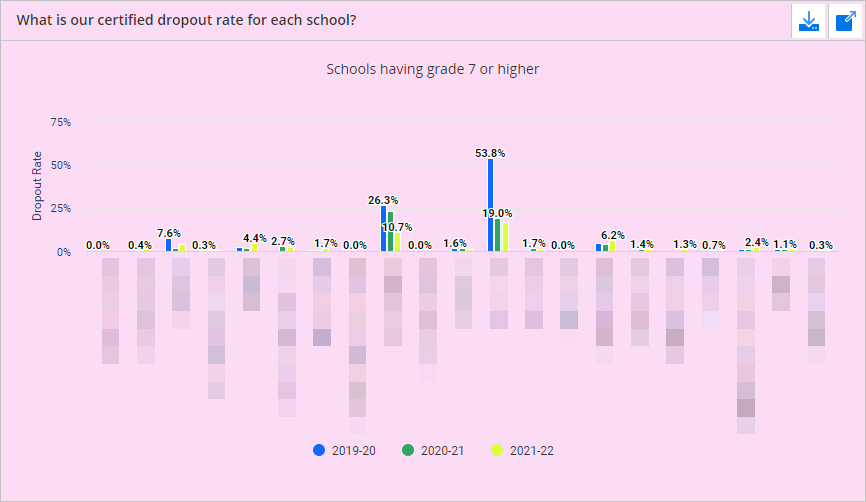
Hovering your cursor over each bar will display a floating ‘pop-up’ that names the percentage of dropouts and its equivalent measure by number of students, within each school.
What is Our Certified Chronic Absenteeism Rate at Each School?
This measures the percent of students enrolled at least 90-days with an attendance rate less than 90%, divided by the number of students enrolled at least 90-days. This data reflects the past three years of certified data.
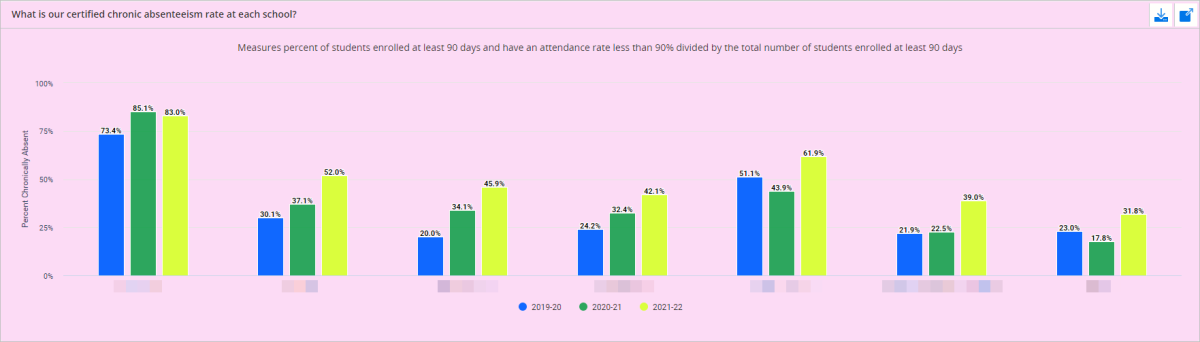
Hovering your cursor over each bar will display a floating ‘pop-up’ that names the percentage of chronically absent students and its equivalent measure by number of students, within each school.
-
ASSESSMENTS
-
WISEadmin/WISEdash Administrator: Assessments
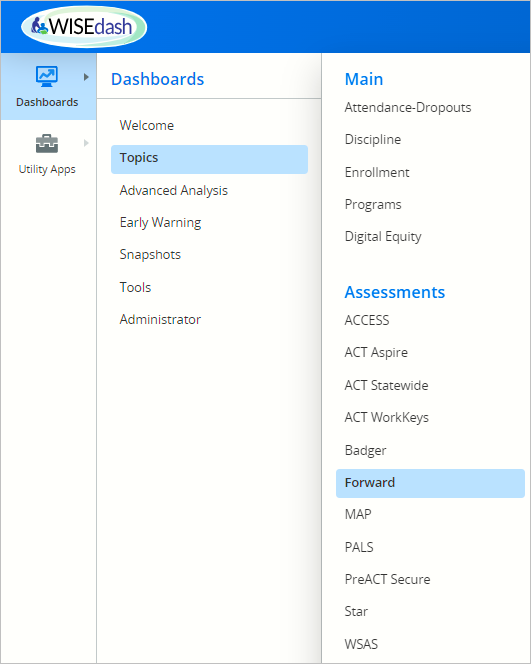 Clicking “Assessments” listed under the Administrator dashboard will redirect users to the Topics dashboard for Assessments > Forward.
For details on this dashboard please visit the WISEdash for Districts, About the Data: Forward Exam Dashboard.
There are WISEdash for Districts, About the Data pages for the following assessments as well:
- ACCESS
- ACT Aspire
- ACT Statewide
- ACT WorkKeys
- AP Assessments
- Assessment Analysis
- Badger
- MAP
- PALS
- PreACT Secure
- Star
- WSAS
You may also visit the WISEdash for Districts, How-To: Assessment User Guides webpage.**
**NOTE: Not all of these User Guides have been updated to reflect the new WISEdash for Districts layout yet. We appreciate your patience as we work to upgrade our resources.
- GROWTH
-
WISEadmin/WISEdash Administrator: Growth
Clicking “Growth” listed under the Administrator dashboard will redirect users to the Topics dashboard for Growth > Student Growth Percentile by School.
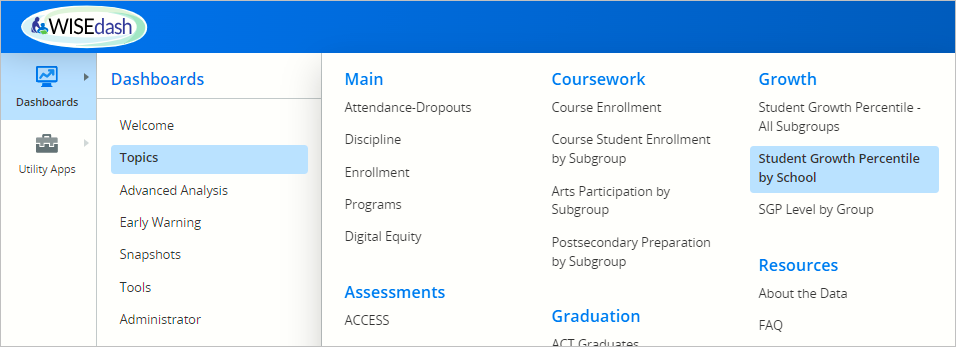
For details on this dashboard please visit the WISEdash for Districts, About the Data: Growth Dashboard webpage.
- SCHOOLS
-
WISEadmin/WISEdash Administrator: Schools
Clicking “Schools” listed under the Administrator dashboard will redirect users to the Tools dashboard for Schools > School List.
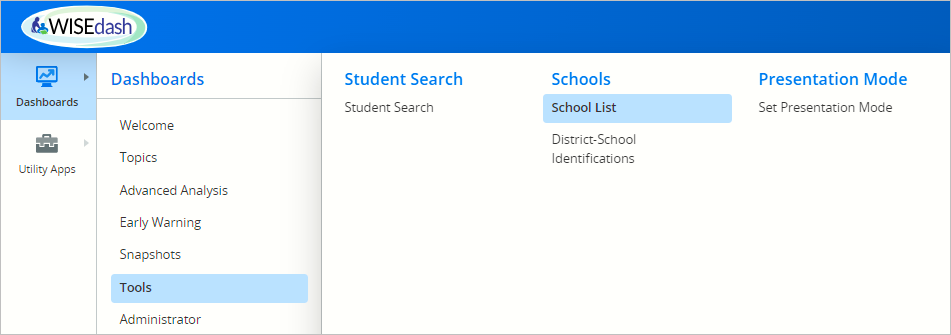
For details on this dashboard please visit the WISEdash for Districts, How-To: Schools List webpage**
**NOTE: Not all of these User Guides have been updated to reflect the new WISEdash for Districts layout yet. We appreciate your patience as we work to upgrade our resources.